New resources for Scorecard execution
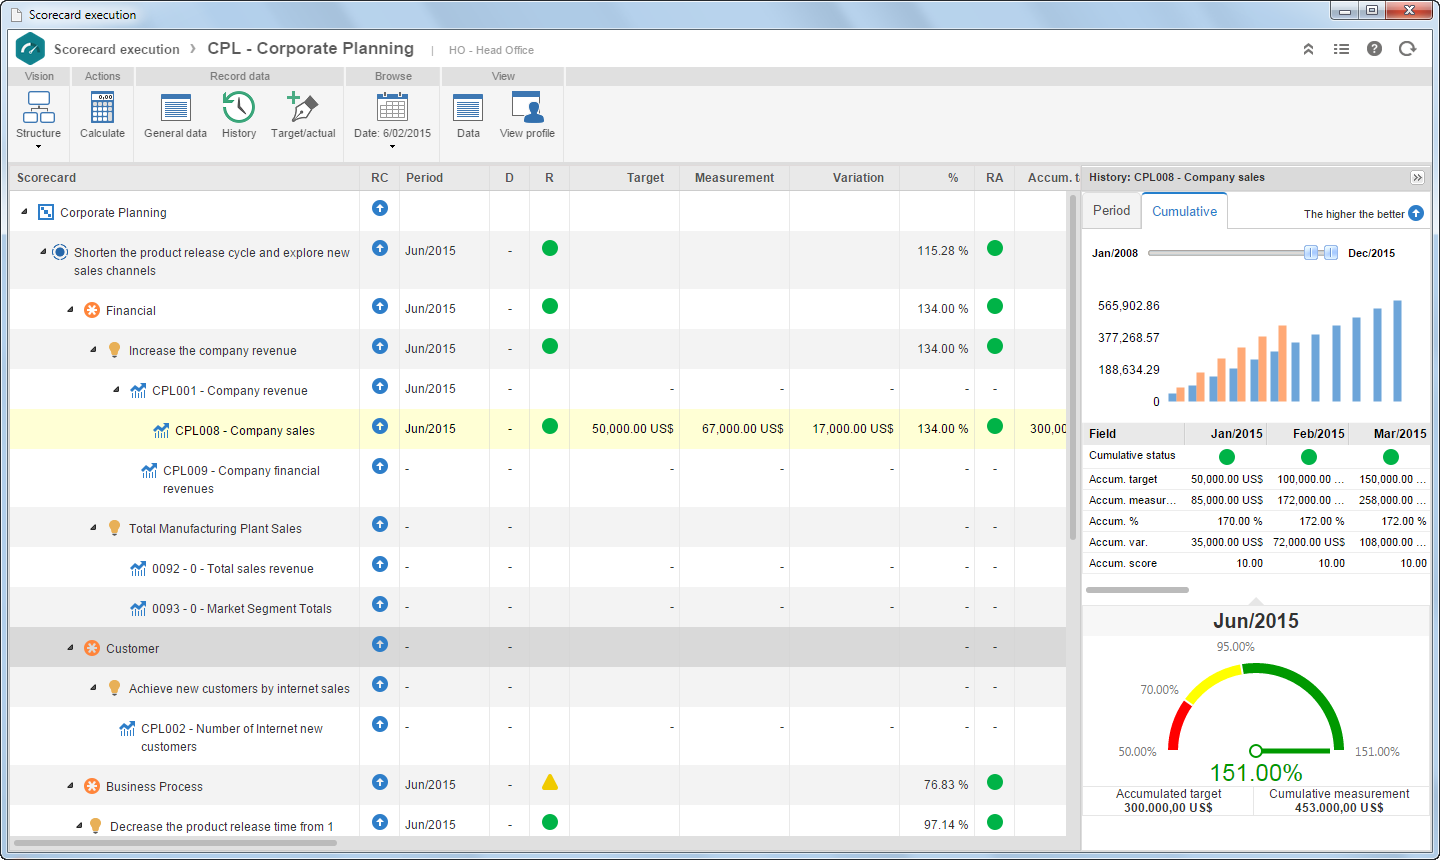
Scorecard execution screen was restructured and this improved results visualization and display of Scorecard results.
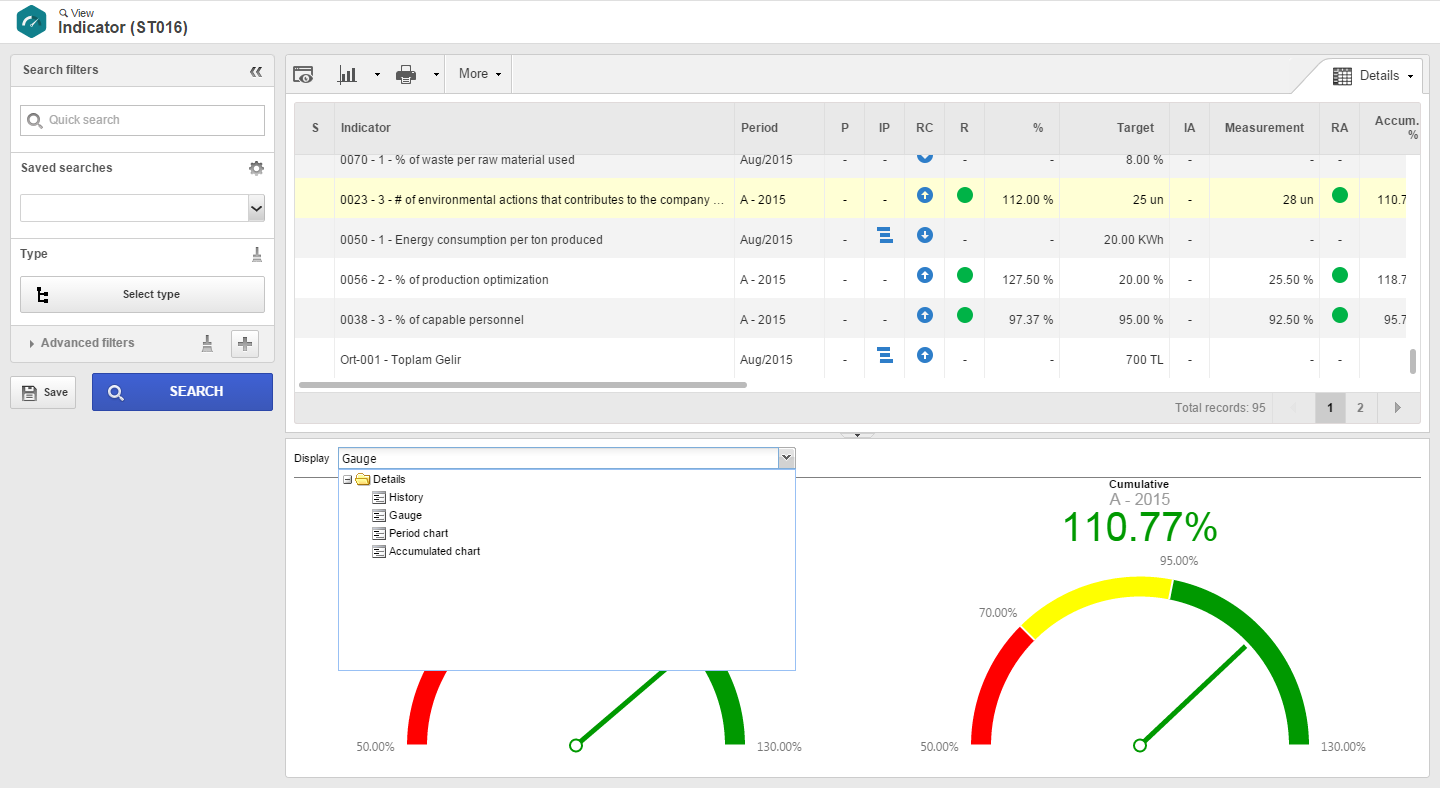
Graphic components of Indicator/Element History screen, were rearranged and this improved the visualization of values in the Scorecard Structure view; consequently, user does not need to open the details screen for a deeper analysis.
A new Gauge component has a configuration that facilitates gauge customization, depending on the identity of the company and allows to use other formats to view the Gauge.
To standardize system visualization, all range icons, element and indicator were checked. The icons keep the same characteristics, but with modern formats. New icons can be seen in widgets, Scorecard planning and execution, Element/indicator views and details.
To simplify the use of the component, Indicator value was removed from Management menu. This functionality was added to Scorecard Execution screen, so that user has in only one place all necessary management tools for the Scorecard. Restructuring Target and Indicator value screen allows manager to concentrate on Scorecard management, and to facilitate maintenance of indicators.
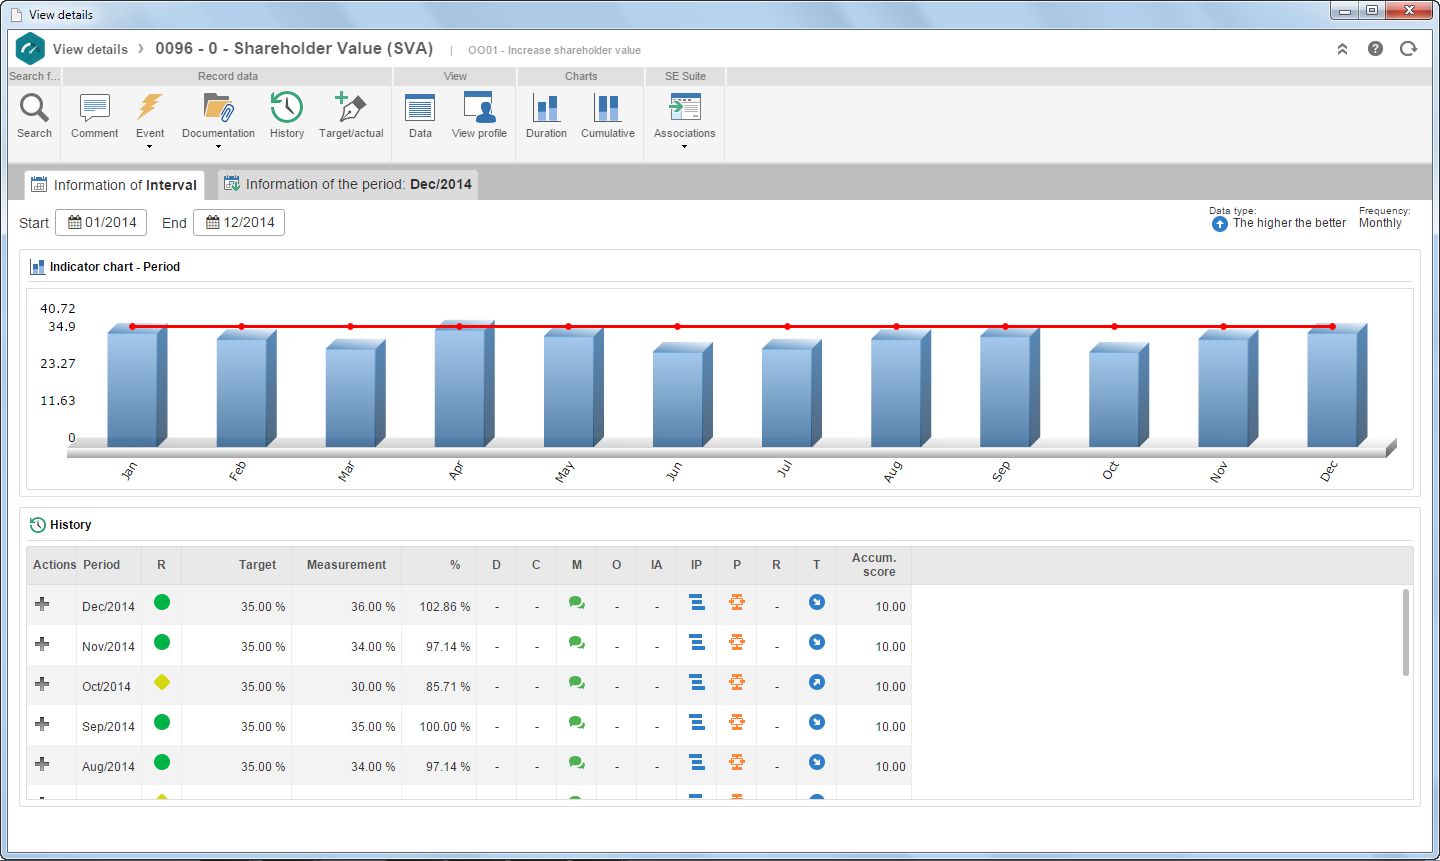
Indicator details were improved
Indicator/element details screen was modified, to improve the way values and indicators are displayed. Any customization of panels of the Indicator/element details screen is in the View profile. Main functionalities facilitate choosing and moving panels according to the indicator characteristic. This screen displays all necessary information for a detailed analysis of the indicator. Charts can display accumulated values grouped by years and this visualization can be configured in the View profile.
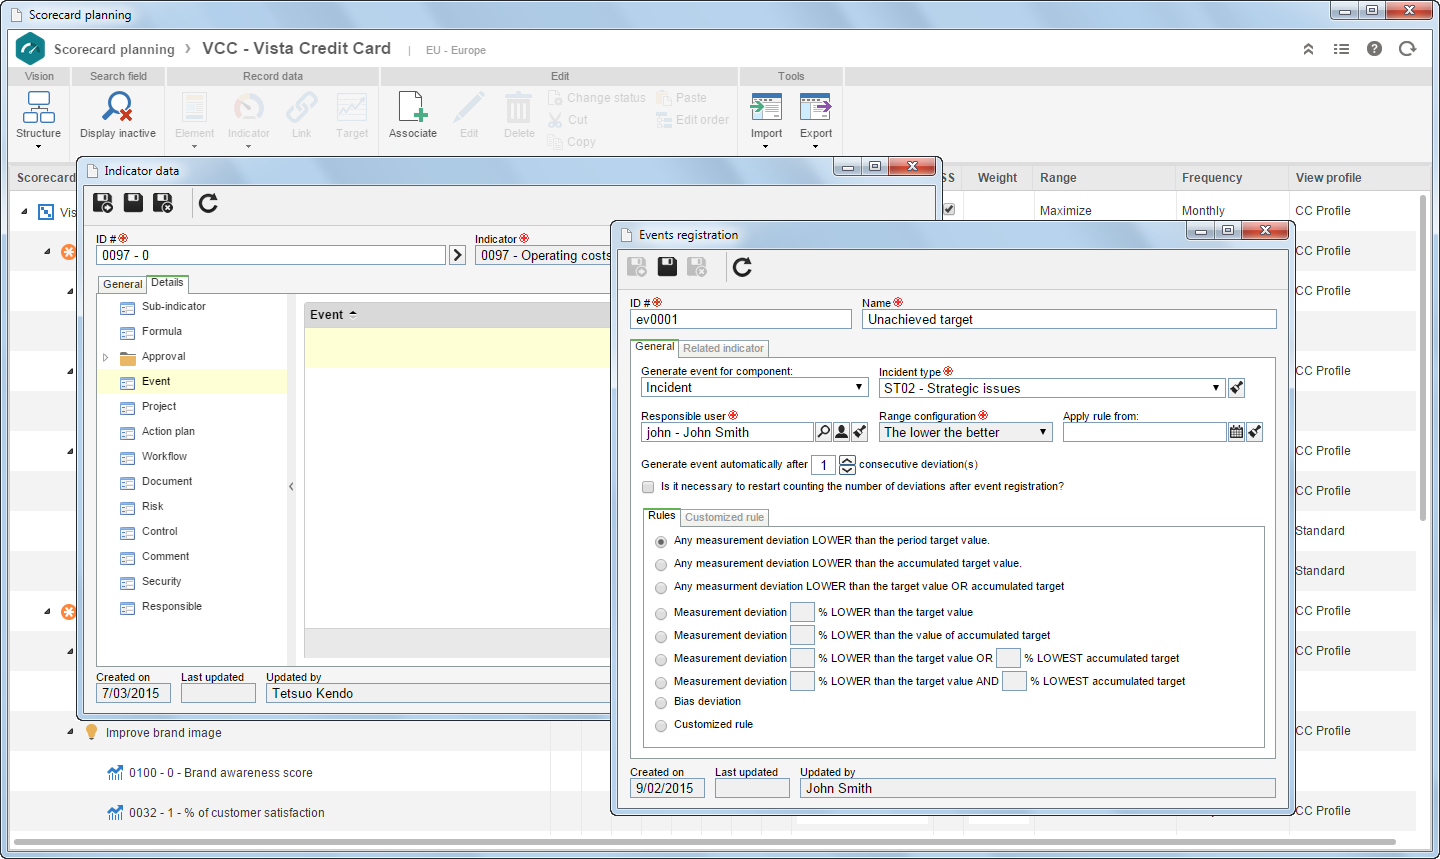
Event generation (Incident/Problem/Action/email)
1.3 version was modified and improved, clients required customizations and they were performed; specifically regarding event generation (Problem, Incident, Occurrence and send email) of indicators. Such improvements and customizations were analyzed and developed in version 2.0.
The actions to make required changes in occurrence generation were centralized. Emails will be automatically sent through 'Events' functionality. The objective is to maintain all existing functionalities, but using a different and standardized configuration. The main characteristics to restructure event generation of indicators associated with the Scorecards are:
1.Pre-configured rules that facilitate the configuration of an event;
2.Rule customization;
3.Configuration of a date to enable the event, frequently used in indicators that keep historical data.
4.Restart count of registered events from each generated event.
5.Associate more than an event with the indicator, for instance, there can be a different rule depending on the indicator result.
Improvement in indicator view
Besides general changes made to the view screen, a 3º quadrant is displayed now in the Indicator view of SE Suite 2.0, which displays all indicator details; new filters were added (Responsible, Element, Frequency, etc.); this will make data return faster; revision of screen icons and hints.
Initiative and Occurrence view functionalities of previous version were added to the Indicator view. Thus, indicator view has more functionalities that maximize view use and customization.
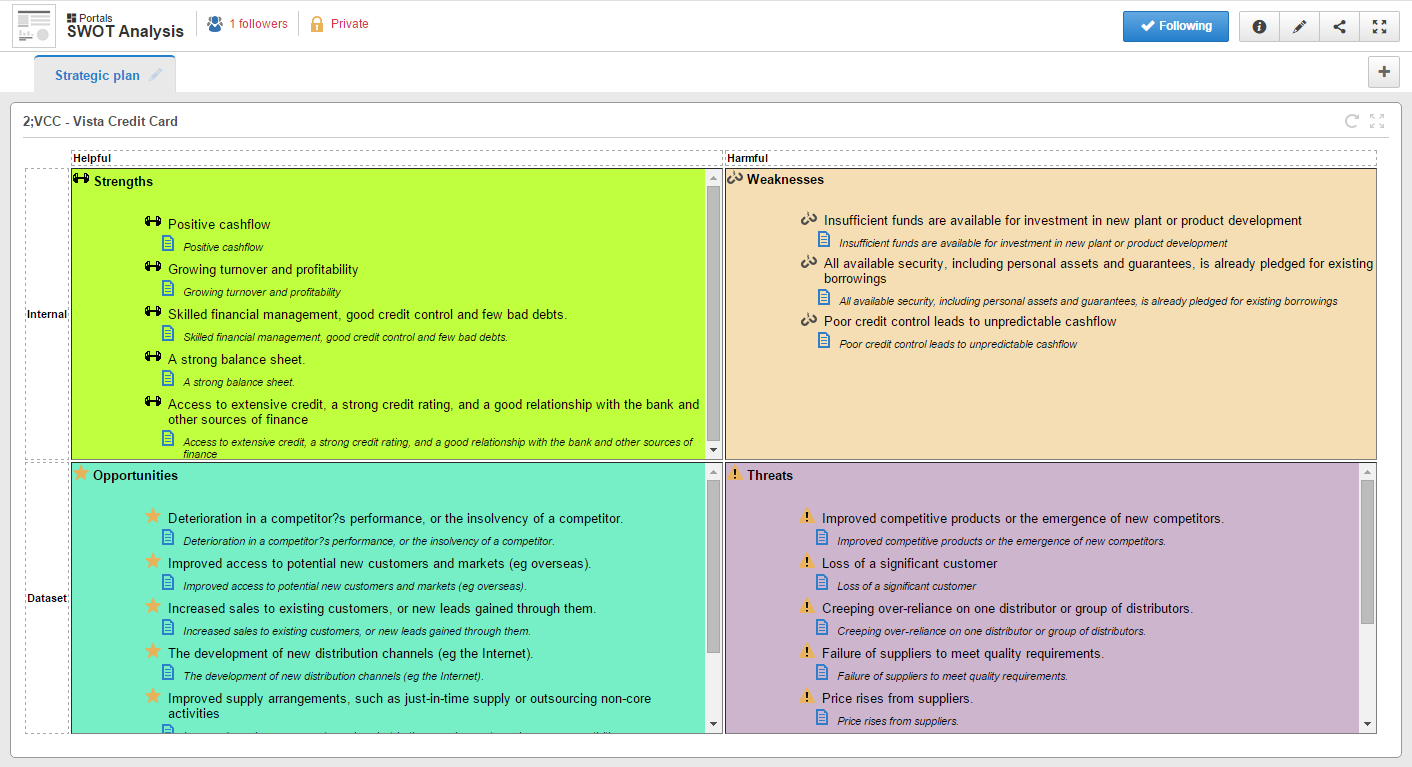
SWOT analysis in Portal (widget)
The use of SWOT analysis (Strengths, Weaknesses, Opportunities and Threats) in the portal, helps in the Company management and strategic plan. The use of this type of analysis is simple and helps managers present the strategy to those who are interested.
SWOT analysis in SE Performance includes ergonomic improvements and the possibility to associate an element from Scorecard with an item of SWOT analysis. Such improvement allows to track the strategic objectives that decompose from the SWOT analysis.